|
Data Management Terms
Mean: average ( add up all the numbers and divide by the number of numbers you have) Median: The middle number. Remember to put the numbers in order first! Mode: The most common number in a set of data Range: high-low number x axis: horizontal y axis: vertical Broken Line Graph: showing trends over time Pie charts: fractions, percent in a pie form Pictograph: using pictures to represent data Primary Data: data you collect Secondary Sources: data from internet, books, etc Scatterplots: Grade 6 Stem & Leaf Plot |
Grade 5/6 expectations:
|
Data Management Links
Create A Graph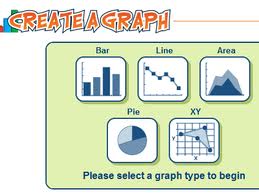
|
Collecting Data
|
